Quenching
Most galaxies follow a the tight relation between stellar mass and star formation rate (SFR) of galaxies, known as the star-forming main sequence (MS) which persists out to high redshift (Popesso et al. 2023). Galaxies that have shut down star formation are referred to as quenched, quiescent or passive. A plethora of mechanisms has been proposed to explain the quenching of galaxies, each acting on different timescales and classes of galaxies. Some of these mechanisms such as environmental quenching are less efficient at high redshift since density contrasts between (proto-)clusters and the field are relatively small at high redshift of \(z > 2\) (Overzier 2016). Nonetheless, quiescent galaxies have been detected at much higher redshift with their number density predicted to correlate inversely with redshift, down to \(\sim 10^{-4.5}\) Mpc\({}^{-3}\) (JWST CEERS, Carnall et al. (2023)) at \(z\approx 5\).
Our theoretical work into high-redshift quenching (Dome et al. 2023) is motivated by observations of the two highest-redshift quenched galaxies. Recently, Looser et al. (2023) reported the discovery of a quiescent galaxy (\(\log_{10}(\mathrm{SFR}\)[\(M_{\odot}/\mathrm{yr}\)]\() = -2.6^{+1.5}_{-2.7}\)) at a reionization-era redshift of \(z=7.3\) by analysing the H\(\beta\) and [OIII]\(\lambda5008\) emission-line fluxes as observed with JWST / NIRSpec. The mass of this quiescent galaxy is \(M_{\star} = 5.0^{+1.3}_{-1.0} \times 10^8 \ M_{\odot}\), which implies a specific SFR (sSFR) of \(\log_{10}(\mathrm{sSFR}\)[\(\mathrm{yr}^{-1}\)]\() = -11.3^{+1.6}_{-2.8}\). The second-highest redshift quiescent / post-starburst galaxy reported to date is at \(z=5.2\) (Strait et al. 2023) with an even lower stellar mass (for the main bulge) of \(M_{\star} = 4.3^{+0.9}_{-0.8} \times 10^7 \ M_{\odot}\) and SFR\((\mathrm{H}\alpha) = 0.14^{+0.17}_{-0.12} \ M_{\odot}/\mathrm{yr}\). This implies \(\log_{10}(\mathrm{sSFR} [\mathrm{yr}^{-1}]) = -8.5^{+0.4}_{-0.9}\). Observationally, it is difficult to assess whether these two galaxies will be permanently quenched or whether they will rejuvenate and return to the MS. Also note the different timescales probed by the emission lines. Short timescales are traced by H\(\alpha\), H\(\beta\) and UV emission lines while longer ones typically by near-infrared to far-infrared (NIR-FIR) indicators (Katsianis et al. 2020).
Can the population of low-mass high-redshift quiescent galaxies be explained with simple models of bursty star formation? At high redshift and lower stellar masses, an equilibrium between stellar feedback and gravity cannot be sustained, leading to bursty star formation (Faucher-Giguère 2018). Therefore, although the galaxy population might still follow the MS at high redshift, their trajectory about the MS could be dominated by short-term bursts of star formation triggered by various processes such as the merging of galaxies or the inflow of gas (Rodríguez-Puebla et al. 2016). These bursts are separated by periods of relative quiescence in which galaxies fall off the star-forming MS. It is therefore of great interest to infer SFRs that probe different timescales in order to observationally constrain the burstiness of low-mass and high redshift galaxies (Faisst et al. 2019).
The discoveries by Looser et al. (2023) and Strait et al. (2023) motivated us to investigate the properties of high-redshift quiescent galaxies with low stellar masses (\(M_{\star} = 10^7-10^9 \ M_{\odot}\)) using theoretical models. Specifically, we use four galaxy formation models: the periodic box simulation IllustrisTNG (Nelson et al. 2019), the zoom-in simulation VELA (Zolotov et al. 2015) and an empirical halo model (EHM, Tacchella et al. (2018)). These four models allow us to study this galaxy population from complementary viewpoints since they provide access to different dynamic ranges and timescales. The combination of those four models allows us to cross-check the consistency of predictions on the theory side. All four models produce quiescent galaxies with \(M_{\star} = 10^7-10^9 \ M_{\odot}\) at \(z>4\). However, these galaxies are only temporary quiescent and rejuvenate back onto the MS. In order to differentiate this process from star formation quenching at higher stellar masses (\(M_{\star} > 10^{10} \ M_{\odot}\)), we refer to this temporary quenching as mini-quenching. We show in this work that the main causes for mini-quenching are stellar feedback, lack of gas accretion onto galaxies, mergers and tidal interactions. The abundance of these mini-quenched galaxies (MQGs) is in good agreement between the four galaxy formation models. However, we find that the level of burstiness inferred from the four models on short timescales \(\sim 40\) Myr is lower than what is observed.
Star-Forming MS
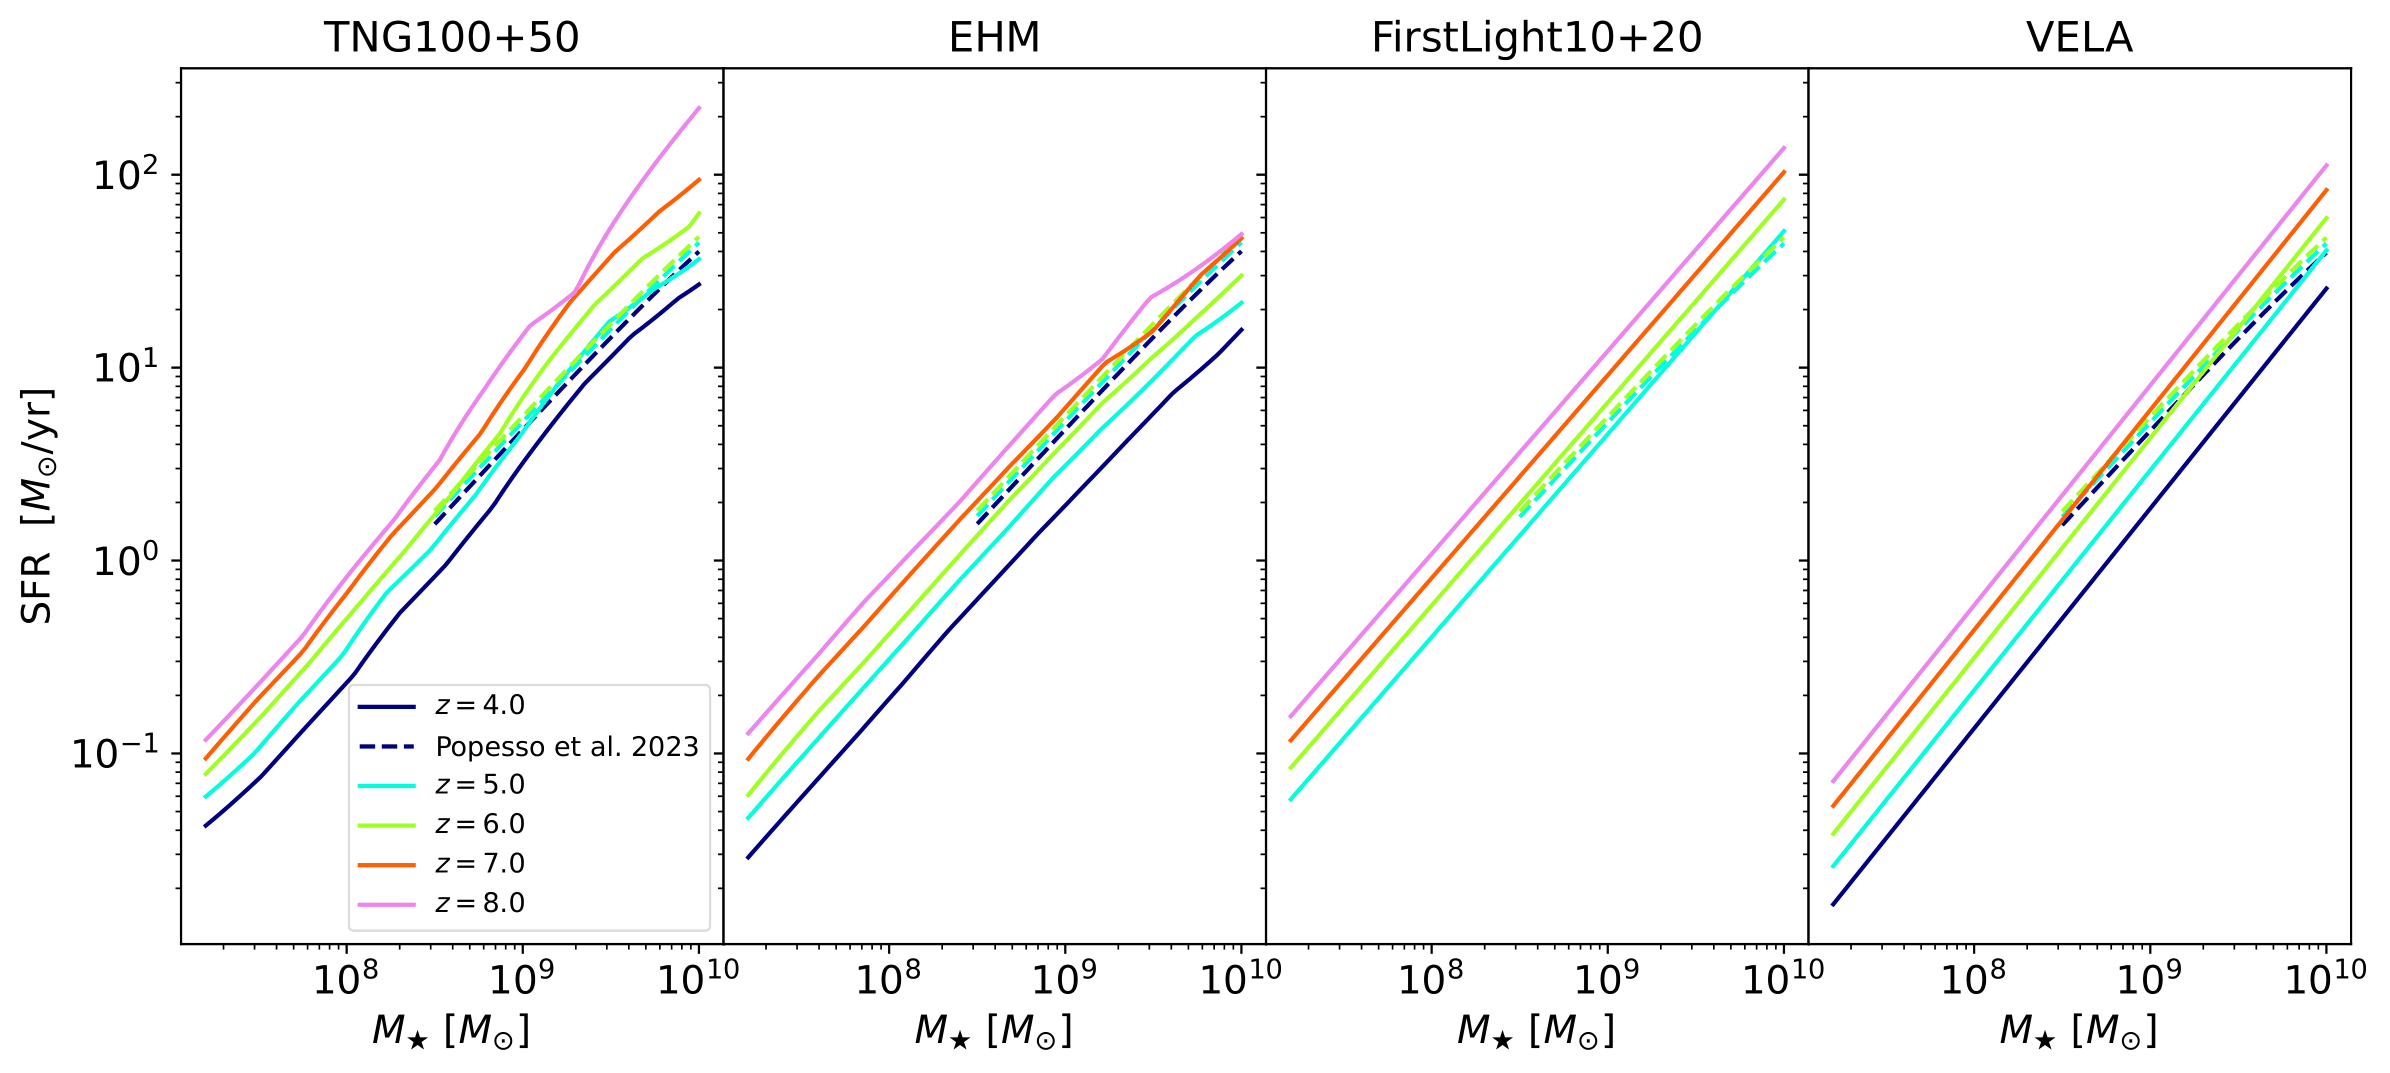
To define the star-forming MS in TNG and EHM, we follow Donnari et al. (2019) and iteratively remove quiescent galaxies until the median SFR in a given mass bin converges. The MS is thus allowed to deviate from a log-linear trend, as in fact it does by exhibiting a turnover at about \(M_{\star} \gtrsim 10^{10.5} \ M_{\odot}\) (Lee et al. 2018). Depending on how a star-forming galaxy is defined observationally, this trend may persist up to \(z\approx 6\). The bending MS estimation is performed at \(z=4,5,6,7,8\) with results shown in Fig. 1. We recover the well-known fact that the normalization increases with redshift at fixed stellar mass. This can be traced to the stellar mass growth time-scale (the ratio of stellar mass to star formation rate) which is expected to be comparable to the Hubble time (Ma et al. 2018). As seen in Fig. 1, this trend becomes weaker towards higher redshift. To obtain SFHs in between these redshifts, we interpolate the MS.
In FirstLight10+20 and VELA, the MS ridge is parametrized as
\[\text{sSFR}_{\text{MS}}(M_{\star},z)=s_{\text{b}}\left(\frac{M_{\star}}{10^{10}M_{\odot}}\right)^{\beta}(1+z)^{\mu}\ \text{Gyr}^{-1}.\]For VELA, the best-fit parameters are \(s_{\text{b}} = 0.046\), \(\beta = 0.14\) and \(\mu = 5/2\) (Tacchella et al. 2016) while for FirstLight10+20 we find \(s_{\text{b}} = 0.064\), \(\beta = 0.05\) and \(\mu = 2.45\). Across the mass range \(M_{\star} = 10^7-10^{10} \ M_{\odot}\), the MS ridges are only consistent to within \(\sim 30\)% between the four galaxy formation models at any given redshift, see Fig. 1. Compared to observations of the star-forming MS as compiled by Popesso et al. (2023), while TNG100+50 and FirstLight10+20 are in good agreement therewith, EHM and VELA typically have smaller normalizations. This deviation is evident for VELA galaxies whose stellar-to-virial mass ratios are higher than deduced from observations Ceverino et al. (2014).
Quiescent (star-forming) galaxies are those whose SFR value falls below (above) a certain relative distance from the median SFR at the corresponding mass. One popular choice is to define as quiescent those galaxies whose logarithmic specific star-formation rate is sSFR \(< 10^{-11} \ \text{yr}^{-1}\) (Merlin et al. 2019). Alternatively, some authors adopt a threshold such as \(2\times \sigma_{\text{MS}} \sim 0.6\) dex (Tacchella et al. 2016) from the MS. However, here we choose a selection criterion of \(0.75\) dex from the MS at all redshifts unless explicitly noted. We choose stellar mass bins of width \(0.25\) dex.
 |
|---|
| Fig. 1: The star-forming MS in the four galaxy formation models investigated in this work across redshifts \(z=4-8\): the combined simulation study TNG100+50 (first panel), EHM (second panel), FirstLight10+20 (third panel) and VELA (fourth panel). SFRs are averaged over \(10\) Myr. A compilation of observational studies by Popesso et al. (2023) is given in the form of a common parametrization (dashed curves) below \(z\leq 6\) for \(M_{\star} \geq 10^{8.5} \ M_{\odot}\). The MS ridges in the four models are consistent to within \(\sim 30\)\%, with TNG100+50 and FirstLight10+20 predictions closest to observational constraints. |
Scatter around the MS
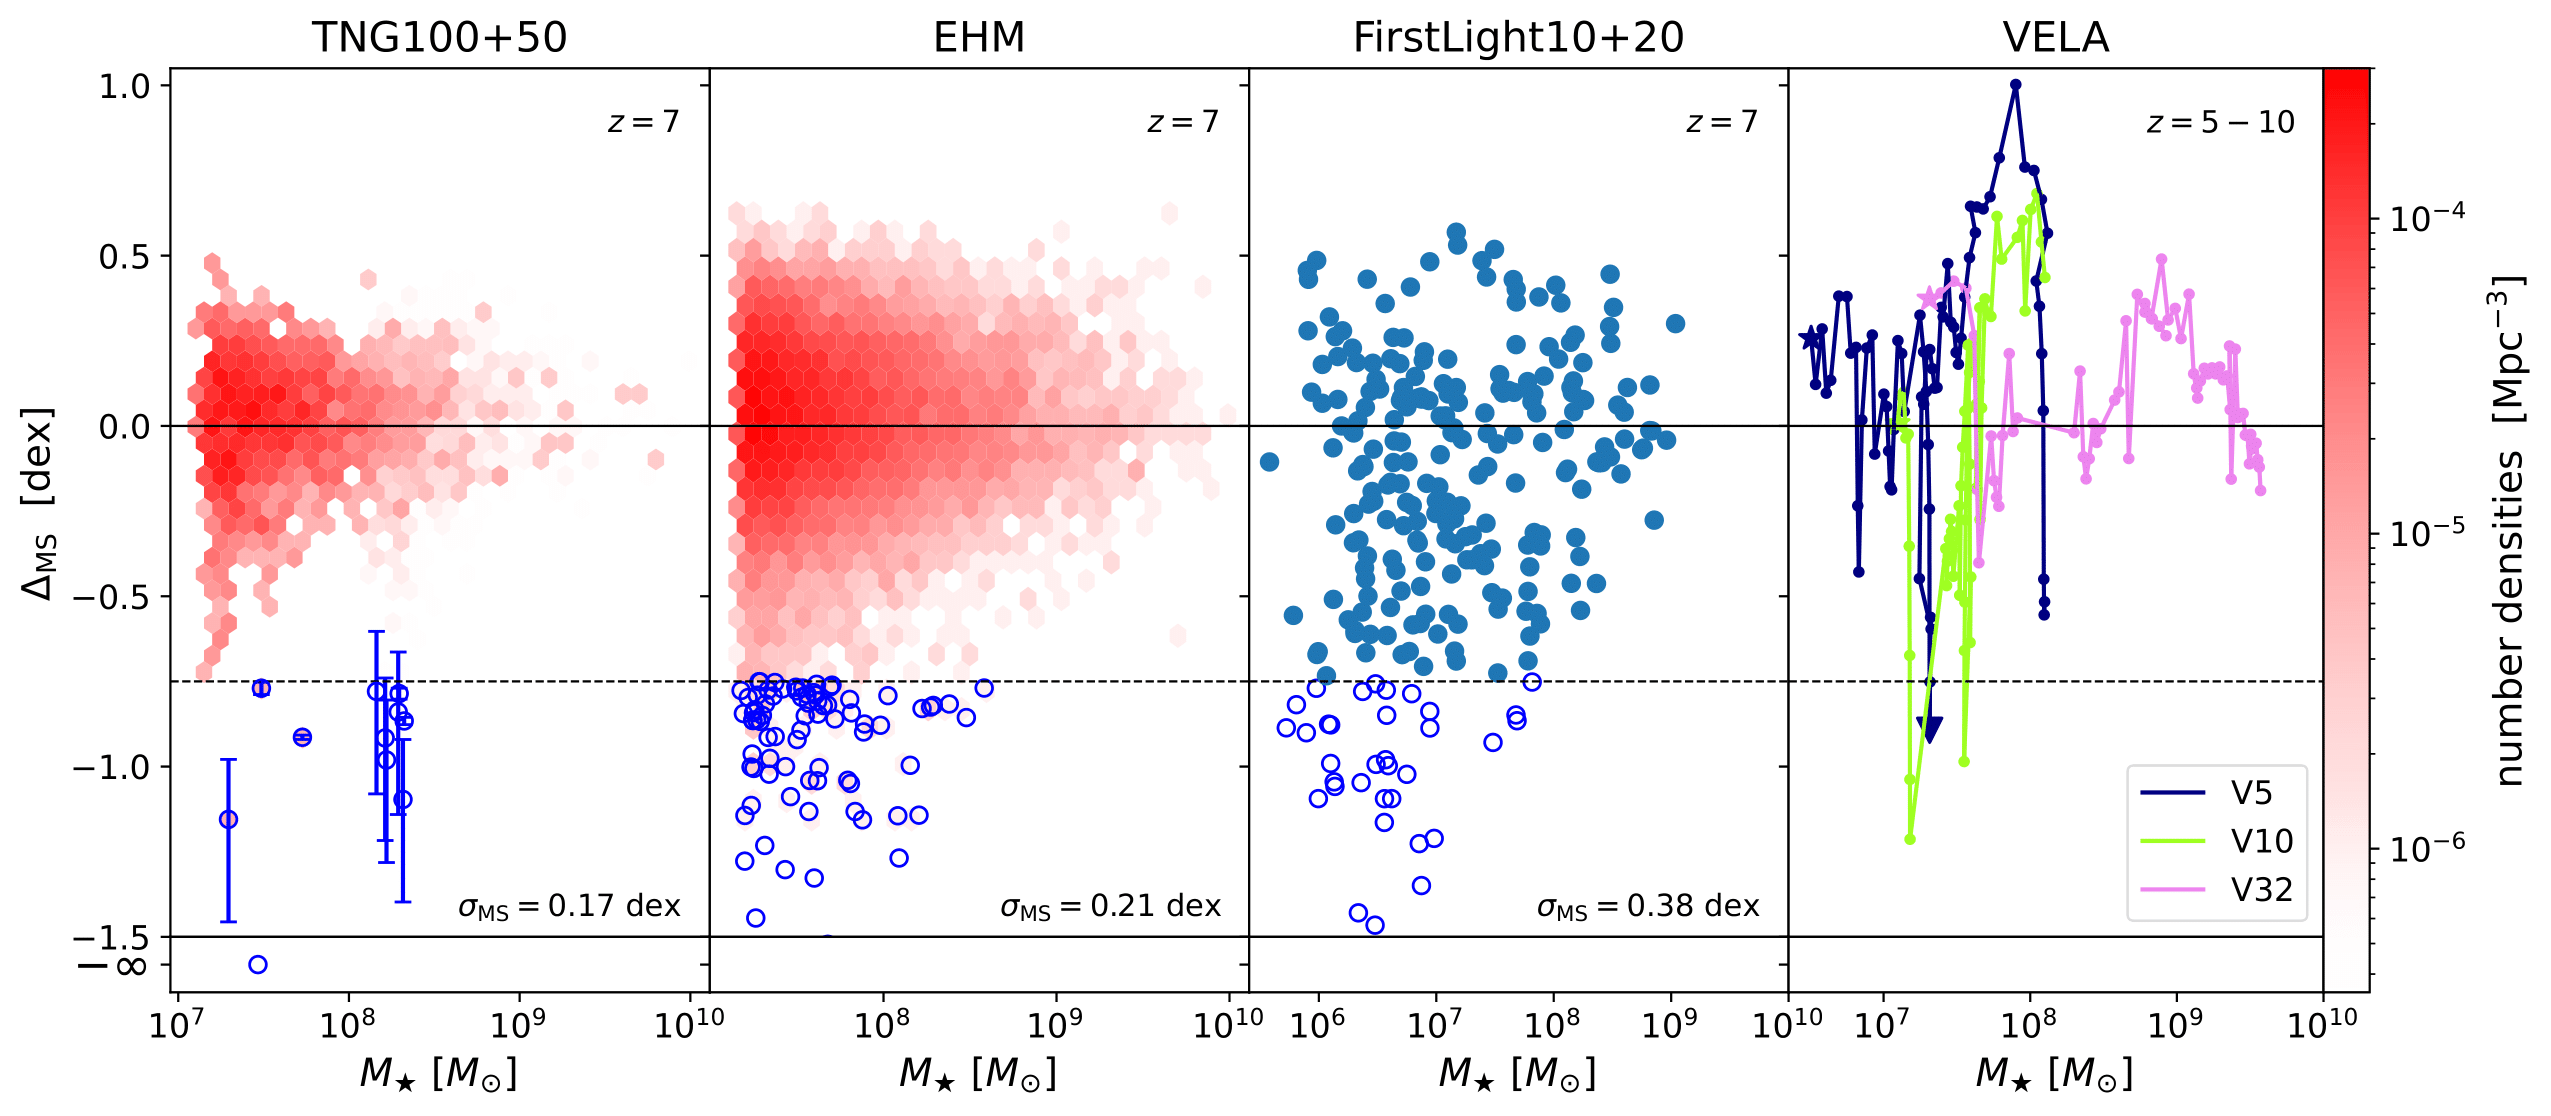
The distribution of galaxies around the star-forming MS in the various galaxy formation models is shown in Fig. 2. Quiescent galaxies suffer from a higher SFR uncertainty, which we accommodate by adding error estimates from bootstrapping to the TNG100+50 results. Specifically, for each galaxy we bootstrap over the initial masses of stellar particles that formed in the last \(10\) Myr (averaging timescale) before \(z=7\). We assume a scatter of \(m_{\star}/2\) if only \(1\) stellar particle of mass \(m_{\star}\) formed over the last \(10\) Myr. Note that upper and lower error bars are asymmetric.
We find that the scatter \(\sigma_{\text{MS}}\) around the MS decreases towards higher stellar mass. For instance, at \(z=7\) TNG100+50 galaxies in the stellar mass range \(M_{\star} = 10^7-10^{7.5} \ M_{\odot}\) have a scatter of \(\sigma_{\text{MS}} = 0.18\) while those of mass \(M_{\star} = 10^{8.5}-10^9 \ M_{\odot}\) have \(\sigma_{\text{MS}} = 0.15\). This trend is in agreement with results from FIRE-2 (Ma et al. 2018) and is a result of bursty star formation regulated mainly by stellar feedback and environmental effects. However, the decrease of the scatter towards higher mass is less pronounced in Flares simulations (Lovell et al. 2022), which resolve galaxies above \(M_{\star} \sim 10^9 \ M_{\odot}\). Flares employs a physically motivated model for AGN feedback that takes into account the dynamics of the accretion disk and the surrounding gas as well as the radiation emitted by the AGN, which better reproduces the observed properties of massive galaxies at high redshifts such as sizes, masses and stellar populations (Roper et al. 2022).
The most common approach to infer the evolution of the star-forming MS observationally is by combining galaxy samples at different redshifts for which the SFRs are estimated for every galaxy. More robust determinations of total SFRs and the portions associated with the unobscured, SFR\(_{\text{FUV}}\), and obscured, SFR\(_{\text{IR}}\), regimes bridge the gap with other constraints such the galaxy stellar mass function of star-forming galaxies and the FUV and IR luminosity functions (Rodríguez-Puebla et al. 2016). UV-derived SFRs tend to indicate a scatter of \(\sim 0.25-0.30\) dex (Fang et al. 2018). Driven by stochastic, bursty SFHs at the low-mass end and the presence of bulges, bars but also AGN at the high-mass end, the dispersion can increase to \(\sim 0.4\) dex (Popesso et al. 2019). According to Davies et al. 2019, the scatter might follow a minimum vertex parabolic U-shape decreasing with stellar mass from \(\log (M_{\star}/M_{\odot}) \sim 8-10\) and then incrseasing at \(\log (M_{\star}/M_{\odot}) \sim 10-11.5\). Note though that few studies go above \(z\approx 5\).
 |
|---|
| Fig. 2: Galaxies about the star-forming MS in a combined simulation study of TNG100+50 (first panel, shown for \(z=7\)), EHM (second panel, shown for \(z=7\)), FirstLight10+20 (third panel, shown for \(z=7\)) and VELA (fourth panel, shown for \(z=5-10\)). Quiescent galaxies are highlighted with blue circles and lie below the selection threshold of \(0.75\) dex below the MS, shown in dashed black. For TNG100+50, error estimates from bootstrapping over masses of newly formed stellar particles are added to each quiescent galaxy. Galaxies with \(\text{SFR}=0\) are formally assigned a MS deviation of \(\Delta_{\mathrm{MS}}=-\infty\). The colorbar indicates the comoving number density of galaxies. The total MS scatter averaged across \(M_{\star} = 10^7-10^9 \ M_{\odot}\) is indicated in the bottom right of the panels. VELA: Two galaxies with bursty SFHs (V5 and V10) and one galaxy with a more stable SFH (V32) are shown in different colours. SFRs are averaged over \(10\) Myr, corresponding to the distance between two dots in the SFHs. Star symbols indicate the first star formation event (\(z=10\) for V5 and V32 and \(z=8\) for V10). The mini-quenching event of V5 (cf. Fig. 4) is highlighted with a triangle symbol. The abundance of MQGs agrees across the models, with an overall MQG fraction of \(f_{\text{MQG}} = 0.5-1.0\)% at \(z=7\). |
TNG likely underestimates the scatter around the MS at higher mass compared to observations given that the AGN feedback is modeled as a simplified subgrid process, where the (fully isotropic) energy and momentum injection from the AGN is regulated by a set of rules based on the accretion rate and black hole mass (Weinberger et al. 2017). The EHM, VELA, FIRE-2 and FirstLight models do not include feedback from AGN and likewise cannot fully capture the complex feedback processes in massive galaxies.
For EHM (Fig. 2, second panel), we in addition see that the overall number of galaxies is larger than in the case of TNG100+50 (\(17226\) vs \(2369\) at \(z=7\) in the range \(M_{\star} = 10^7-10^9 \ M_{\odot}\)). EHM might indeed overpredict the galaxy stellar mass function at the low-mass end as hinted at by (Tacchella et al. 2018) whilst the NIR band luminosity function and by extension the galaxy stellar mass function predicted by TNG are largely consistent with observations at high redshift (Shen et al. 2022). Despite that, the total EHM scatter \(\sigma_{\text{MS}} = 0.21\) dex around the MS agrees well with the scatter \(\sigma_{\text{MS}} = 0.17\) dex found for TNG100+50. The MS scatter in EHM comes directly from the scatter in the halo mass accretion rate. FirstLight10+20 exhibits a higher MS scatter \(\sigma_{\text{MS}} = 0.38\) dex than TNG and EHM, which can be traced to FirstLight being able to resolve intense SF bursts on time-scales smaller than \(\sim 10\) Myr.
How long is a Mini-Quenching Event?
SFHs of MQGs in TNG at high redshift trace out a kinky, V-shaped pattern, hinting at bursty star formation (especially) around the mini-quenching event (\(\pm 20\) Myr). However, since SFHs are poorly resolved, we instead investigate mini-quenching timescales in FirstLight and VELA. For a total of \(20\) mini-quenching events in the redshift range \(z=4-8\), we find a median and \(16 / 84\) percentile of \(\tau_{\mathrm{MQ}} = 16.5^{+23.3}_{-7.7}\) Myr for VELA. For comparison, when imposing a selection threshold of \(0.6 \ \text{dex} \sim 2\times \sigma_{\text{MS}}\) (Speagle et al. 2014), we find \(\tau_{\mathrm{MQ}} = 21.5^{+34.4}_{-18.2}\) Myr. In these distributions, VELA galaxy V28 constitutes an outlier which stays quiescent for \(\sim 220\) Myr in the redshift window \(z\approx 4.9-5.7\).
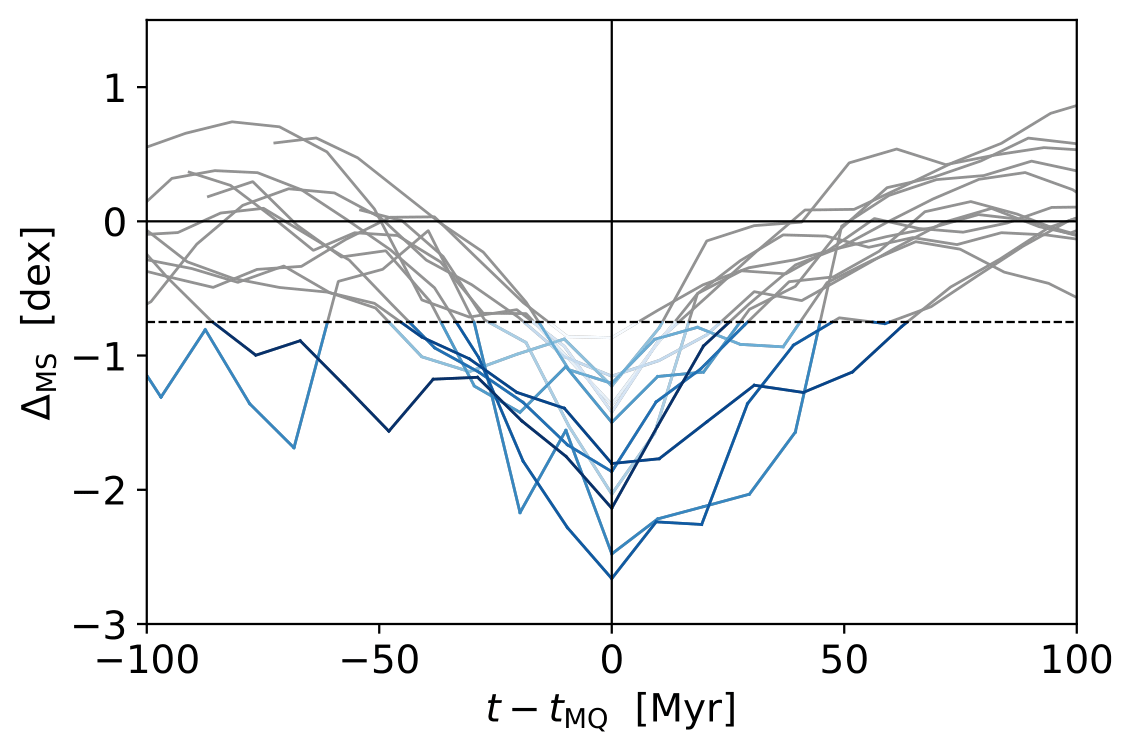
For FirstLight10+20 galaxies, we show SFHs around \(12\) selected mini-quenching events in Fig. 3. The well-resolved trajectories demonstrate the bursty, stochastic nature of star formation at high redshift. Mini-quenching events typically last longer than in VELA as expected from the lower SFR duty cycles. The distribution is centered around \(\tau_{\mathrm{MQ}} \sim 40\) Myr with a heavy upper tail. In fact, the longest mini-quenching events can last up to \(\tau_{\mathrm{MQ}} \sim 100\) Myr before the galaxy rejuvenates.
Expressed in terms of the Hubble time \(t_{\text{H}}(z=7) \sim 760\) Myr, the typical timescale at \(z=7\) is \(\tau_{\mathrm{MQ}} \sim 0.02 \ t_{\text{H}}\). This timescale is more than an order of magnitude smaller than the oscillation timescale \(\sim 0.4 \ t_{\text{H}}\) about the ridge of the MS, indicating that the SFR needs to change significantly on shorter timescales around the mini-quenching event (with a more steady evolution closer to the MS). In the framework of correlated stochastic processes (Iyer et al. 2022), this might suggest different amounts of power on different temporal scales.
 |
|---|
| Fig. 3: Bursty SFHs of FirstLight10+20 galaxies around \(12\) selected mini-quenching events in the redshift range \(z=4-8\). Each trajectory shows the deviation from the MS from \(100\) Myr before until \(100\) Myr after the mini-quenching event. One galaxy undergoes two mini-quenching events separated by \(\sim 30\) Myr. The selection threshold of \(0.75\) dex below the MS is shown in dashed black. Mini-quenching timescales \(\tau_{\text{MQ}}\) are obtained by summing up the time spent below this threshold. We color-code trajectories by the value of \(\tau_{\text{MQ}}\): the higher \(\tau_{\text{MQ}}\), the darker the blue shade. |
The mini-quenching timescale \(\tau_{\mathrm{MQ}} \sim 20-40\) Myr is several times (\(\sim 1/6\)) shorter than the overall free-fall time \(t_{\mathrm{ff}} = (3\pi / (32G\rho))^{1/2} \sim 240\) Myr of a halo of mass \(M_{\text{h}} = 6 \times 10^9\ M_{\odot}\), hosting a galaxy such as V5 of mass \(M_{\star} = 2.1 \times 10^7 \ M_{\odot}\) based on the observed stellar-to-halo-mass relation (Girelli et al. 2020). However, we argue that \(\tau_{\mathrm{MQ}}\) is close to the local free-fall timescale \(t_{\mathrm{ff,loc}}\) of the inner halo where galaxies typically reside. In this picture, after the expulsion of gas in the wake of stellar feedback the galaxy finds itself in a state of mini-quenching until gas gets reaccreted/falls onto the galaxy. The mini-quenching timescale is influenced by the mass distribution of the halo, the density and temperature of the gas, and feedback effects such as radiative winds (Gelli et al. 2023). At high densities and low metallicities, \(t_{\mathrm{ff,loc}}\) can be shorter than the stellar feedback timescales (Dekel et al. 2023), in which case \(\tau_{\mathrm{MQ}}\) will be the closest to \(t_{\mathrm{ff,loc}}\).
Mock SEDs Compared to Observations
To generate mock spectral energy distributions (SEDs) of simulated galaxies, we treat each stellar particle in the respective simulation as a simple stellar population (SSP) using a stellar population synthesis method. Here we opt for the Flexible Stellar Population Synthesis (FSPS) code (Conroy & Gunn 2010) with MIST isochrones and the MILES stellar library, assuming a Chabrier initial mass function (Chabrier 2003) consistent with the TNG galaxy formation model.
To correct for dust attenuation and extinction, we follow (Nelson et al 2018). When applied to TNG, the odel accurately reproduces the observed distribution of optical \((g-r)\) colors from the Sloan Digital Sky Survey. In addition to adopting a simple power-law extinction model (Charlot & Fall 2000) for the attenuation by finite-lifetime birth clouds surrounding young stellar populations as well as the ambient diffuse ISM, we follow the distribution of metals and (neutral) hydrogen gas in and around each simulated galaxy. To obtain neutral hydrogen fraction estimates for star-forming cells in TNG, we post-process the outputs and recalculate the equilibrium fractions according to the (Springel 2003) model to account for the multiphase interstellar medium, including the presence of molecular hydrogen, \(\text{H}_2\). For VELA, we instead employ the total hydrogen column density to estimate the optical depth. The (Nelson et al 2018) resolved dust model then attributes a neighborhood- and viewing angle-dependent attenuation to each stellar particle. We choose the viewing angle randomly as one of the vertices of the \(N_s = 1\) HEALPIX sphere oriented in simulation coordinates.
To bridge the gap with observations, we search for the VELA mini-quenching event that is most similar to JADES-GS-z7-01-QU (\(z=7.3\) and \(M_{\star} = 5 \times 10^8 \ M_{\odot}\)). VELA galaxies at \(z\approx 7\) span the mass range \(M_{\star} \sim 5.3 \times 10^6 -7.4 \times 10^8 \ M_{\odot}\), yet the few galaxies with \(M_{\star} \gtrsim 10^8 \ M_{\odot}\) are far from undergoing mini-quenching. We thus focus on one galaxy (labeled V5 and highlighted in Fig. 2) and its mini-quenching event at \(z=6.7\) and \(M_{\star} = 2.1 \times 10^7 \ M_{\odot}\) as the reference galaxy to compare to JADES-GS-z7-01-QU.
The account for differences in redshift and stellar mass between V5 and JADES-GS-z7-01-QU, we apply flux correction factors \(d_L(7.3)^2/d_L(6.7)^2\) (\(d_L(z)\) being the luminosity distance at redshift \(z\)) and \(M_{\star, \text{V5}}/M_{\star, \text{GS-z7-01-QU}}\), assuming mass-to-light ratio scaling (Schombert et al. 2019). However, incorporating these correction factors we find that the flux density of JADES-GS-z7-01-QU is about a factor of \(5\) stronger than V5 (see Fig. 4, right panel). Can this discrepancy be resolved by modifying metallicities and ages of the simple stellar populations entering the mock SED calculation?
  |
|---|
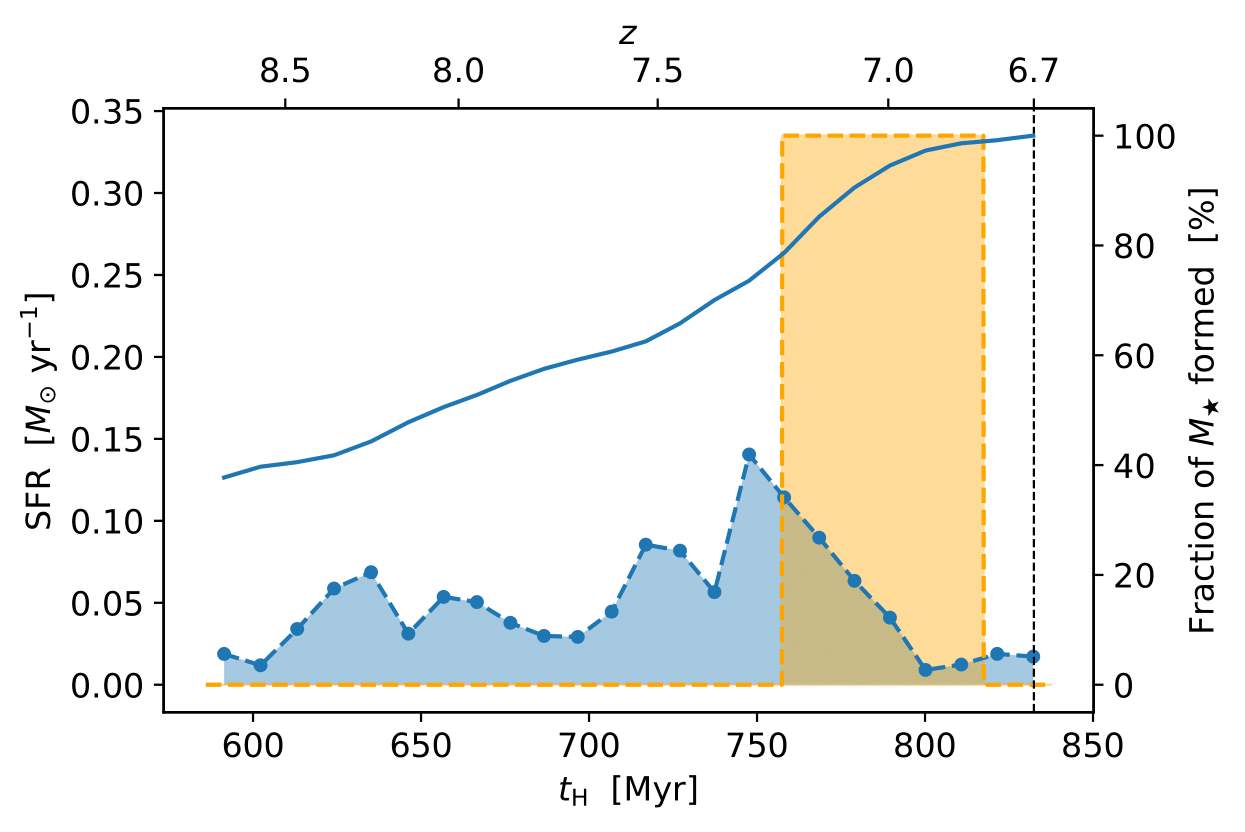
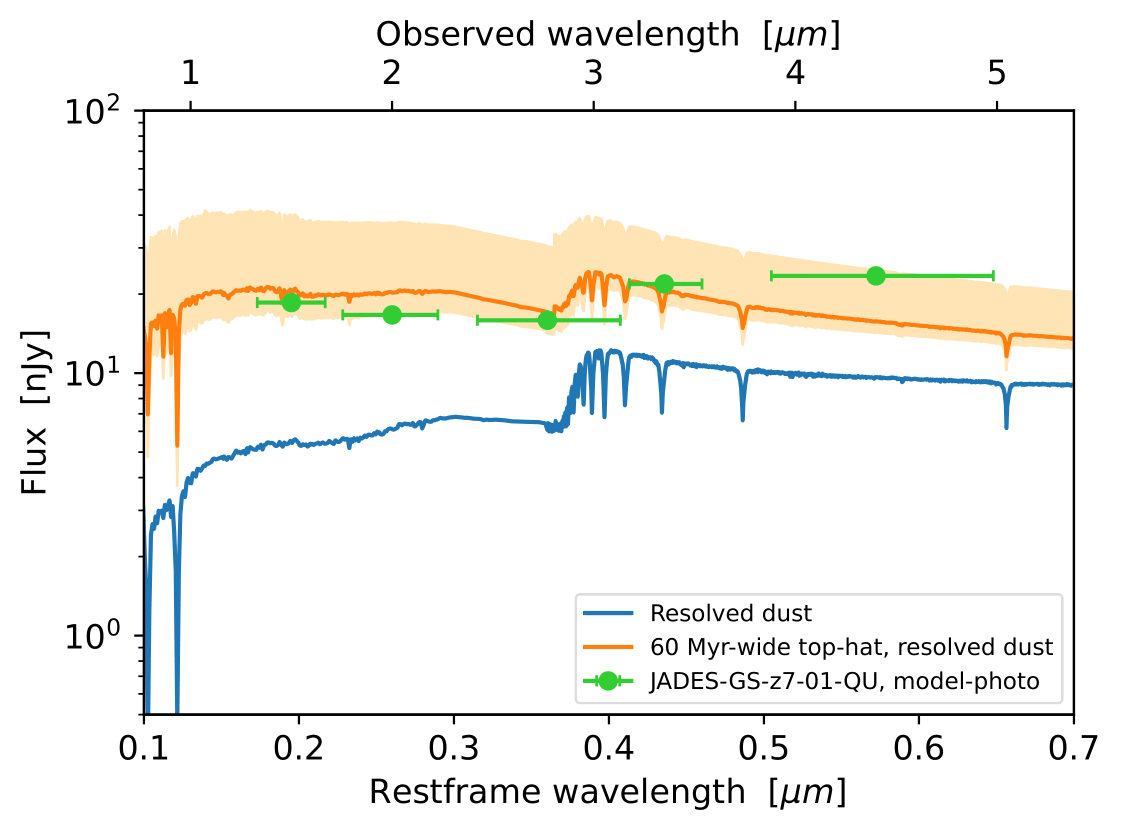
| Fig. 4: Original and modified SFH of the VELA galaxy V5 at \(z>z_{\text{MQ}}=6.6\) (left panel) and corresponding SEDs compared to JADES-GS-z7-01-QU (right panel). Shown are: (a) Original SFH and dust attenuated SED of V5 (blue), (b) Idealised top-hat SFH model of width \(60\) Myr (orange), with corresponding dust attenuated SED (orange), (c) JADES-GS-z7-01-QU photometry (green dots) for filters F150W, F200W, F277W, F335M and F444W. Horizontal bars on the photometry indicate the wavelength range probed by each passband. All SEDs are flux-corrected to account for redshift and stellar-mass offsets between V5 and JADES-GS-z7-01-QU. The orange shade on the right panel is obtained by varying the width of the top-hat from \(10\) to \(90\) Myr. The level of burstiness inferred from VELA on short timescales \(\sim 40\) Myr is lower than what is observed. |
Stellar Metallicity
Stellar populations in V5 are only moderately more metal-rich (\(Z_{\star}\sim 0.04 \ Z_{\odot}\) on average) than deduced for JADES-GS-z7-01-QU, \(Z_{\star}\sim 0.01 \ Z_{\odot}\). Reducing \(Z_{\star}\) artificially for some stellar populations does not modify SEDs by more than \(\sim 0.1\) dex, in accordance with Gelli et al. (2023) (at most \(\sim 0.2\) dex for a reduction of \(Z_{\star}\) by \(2\) orders of magnitude from \(Z_{\star}\sim Z_{\odot}\) to \(Z_{\star}\sim 0.01 \ Z_{\odot}\)), hence we do not explore this path further.
Ages of Stellar Populations
The SFH of V5 (see Fig. 4, left panel) reveals that the simulated galaxy underwent an extended burst of star formation at \(z\approx 7.3\), followed by a gradual suppression of its SFR. At the epoch of observation, \(z=6.7\), the average age of stellar populations is thus \(\sim 230\) Myr. While the shape of the SED (see Fig. 4, right panel) agrees moderately well with JADES-GS-z7-01-QU photometry, the overall normalization does not.
Using BAGPIPES, Looser et al. (2023) infer a top-hat-like SFH and the time elapsed between mini-quenching and the epoch of observation inferred by four different full spectral fitting codes is \(\Delta t_{\text{quench}} = 10-40\) Myr. We thus evaluate the SED of an idealised top-hat SFH. We adopt \(\Delta t_{\text{quench}} = 15\) Myr and vary the top-hat width between \(10\) Myr and \(90\) Myr. The corresponding top-hat heights are \(\text{SFR}=2.02 \ M_{\odot}\text{yr}^{-1}\) and \(\text{SFR}=0.22 \ M_{\odot}\text{yr}^{-1}\), respectively, and the resulting SEDs are shown as the shaded area in Fig. 4 (right panel). The top-hat that gives rise to an SED closest to JADES-GS-z7-01-QU photometry is of width \(60\) Myr (cf. Fig. 4, left panel). The fluxes now reach \(\sim 5\) times higher in the UV and \(\sim 2\) times higher in the red part of the spectrum (observed frame), in good agreement with JADES-GS-z7-01-QU. Since the mock SED flux for wavelengths around the red filter F444W is too low compared to JADES-GS-z7-01-QU photometry, the agreement found for the SED shape is only modest.
Caveats
When artificially modifying SFHs and comparing to observations, it is important to mention two caveats. First, V5 is mini-quenching at \(z=6.7\) and \(M_{\star} = 2.1 \times 10^7 \ M_{\odot}\) as opposed to the inferred epoch of observation \(z=7.3\) and estimated mass \(M_{\star} \sim 5 \times 10^8 \ M_{\odot}\) found for JADES-GS-z7-01-QU. The mass-to-light scaling that we adopt might be an invalid assumption. However, we have repeated the SED analysis for several mini-quenching events in VELA across \(z=6.5-7.5\). For \IBox, we have likewise calculated SEDs of MQGs at \(z=7\), which is the closest redshift at which a resolved dust attenuated SED modelling can be performed, following (Nelson et al 2018). In all cases, we come to the same conclusion: The SEDs can only be reconciled with JADES-GS-z7-01-QU photometry when artificially modifying ages of stellar populations.
Secondly, there are different recipes for dust attenuation modelling, and while an extensive comparison is beyond the scope, we find that differences between e.g. adopting HI vs H column densities only lead to minute effects on the resulting mock SEDs. However, since JADES-GS-z7-01-QU photometry suggests a redder spectrum than we infer for the top-hat SFHs, we speculate that JADES-GS-z7-01-QU is more dust-obscured than V5 and/or has some older populations than the top-hat.
Discussion
We speculate that VELA and TNG galaxies at high redshift are not bursty enough on small timescales \(\sim 40\) Myr to give rise to the high fluxes observed for JADES-GS-z7-01-QU. Only when allowing a maximum burst of star formation (top-hat SFH), matching \(\Delta t_{\text{quench}} = 15\) Myr with the observed one, can the normalization of SEDs be reconciled. While the exact value observed in the red filter F444W is hard to reproduce in mocks, the overall SED shape inferred for a top-hat SFH is in good agreement with JADES-GS-z7-01-QU, including Balmer absorption lines, lack of emission lines, and UV continuum. There is a possibility that JADES-GS-z7-01-QU is in fact an obscured AGN, which would not only provide a mechanism for abrupt quenching but possibly explain the flux discrepancy in the F444W filter. The abundance of (dust-obscured) AGN at high redshift of \(z>5\) might be an order of magnitude higher than expected from extrapolating quasar UV luminosity functions (Larson et al. 2023). However, unlike JADES-GS-z7-01-QU many high-redshift AGN appear to have a strong Balmer break (Kocevski et al. 2023).
Which sub-grid models governing galaxy formation could give rise to higher burstiness on small timescales (\(\sim 40\) Myr) to match the observations? While for TNG galaxies, resolution effects, e.g. \(M_{\star}\) of low-mass galaxies typically increases with resolution, see Pillepich et al. (2018) might also be at play, TNG has been shown to poorly predict some observables at high redshift, e.g. the scatter around the MS at the high-mass end or the abundance of dust-obscured, far-infrared galaxies and thus the obscured cosmic star formation rate density (Shen et al. 2022).
One possibility is that better modelling at high redshift resolves the discrepancies with observations found here. The fact that Gelli et al. 2023 also succeeds in reproducing the SED of JADES-GS-z7-01-QU when artificially modifying SFHs points in that direction. They analyse the SERRA suite of high-resolution zoom-in simulations that includes on-the-fly radiative transfer and a non-equilibrium chemical network. Even though these prescriptions are more suitably in the epoch of reionization than a spatially uniform UV background (Haardt & Madau 2012), the levels of burstiness they infer on small timescales \(\sim 40\) Myr are still too low.